
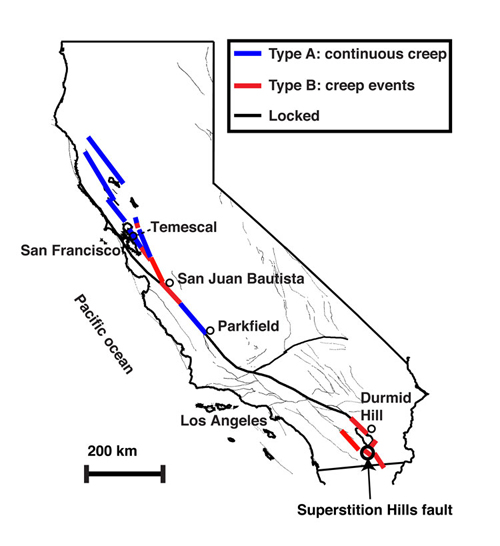
In this map of the major faults in California, fault segments that experience episodic creep events are shown in red. The blue lines indicate segments that experience stable sliding or continuous creep. Fault segments that are “locked” from the surface to the bottom of the fault are shown in black. (Image courtesy of Matt Wei)
(Visited 32 times, 1 visits today)