
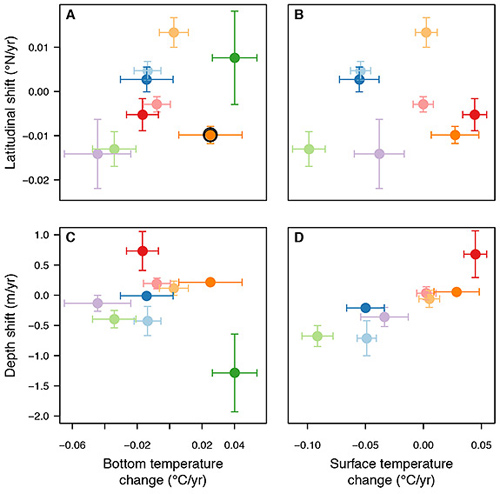
The researchers found that 74 percent of the animals studied changed latitude (A and B) and 70 percent moved to new depths (C and D) in accordance with changes in bottom and surface temperature. The figure shows latitudinal shifts to the north or south (top to bottom) per year, and depth shifts to deeper or shallower (top to bottom) waters in meters per year. Bottom and surface temperature are measured by annual changes in degrees Celsius, either cooler or warmer (left to right). The colors correspond with the regions listed in the figure above. (Image by Science/AAAS)
(Visited 47 times, 1 visits today)