
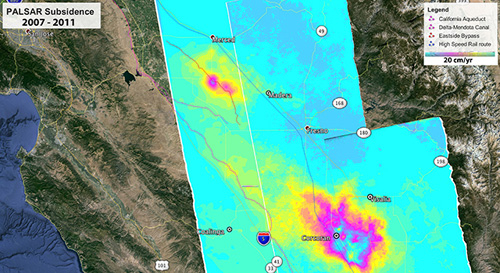
Map showing subsidence (sinking) rates in California’s southern Central Valley from 2007 to 2011 as measured by radar data from the Japan Aerospace Exploration Agency’s PALSAR instrument on JAXA’s Advanced Land Observing Satellite. One full cycle of the color bar equals 20 centimeters (about 8 inches) per year. NASA is using space-based radar data to monitor groundwater depletion in California. Image credit: NASA/JPL-Caltech/JAXA/Google Earth
(Visited 33 times, 1 visits today)