
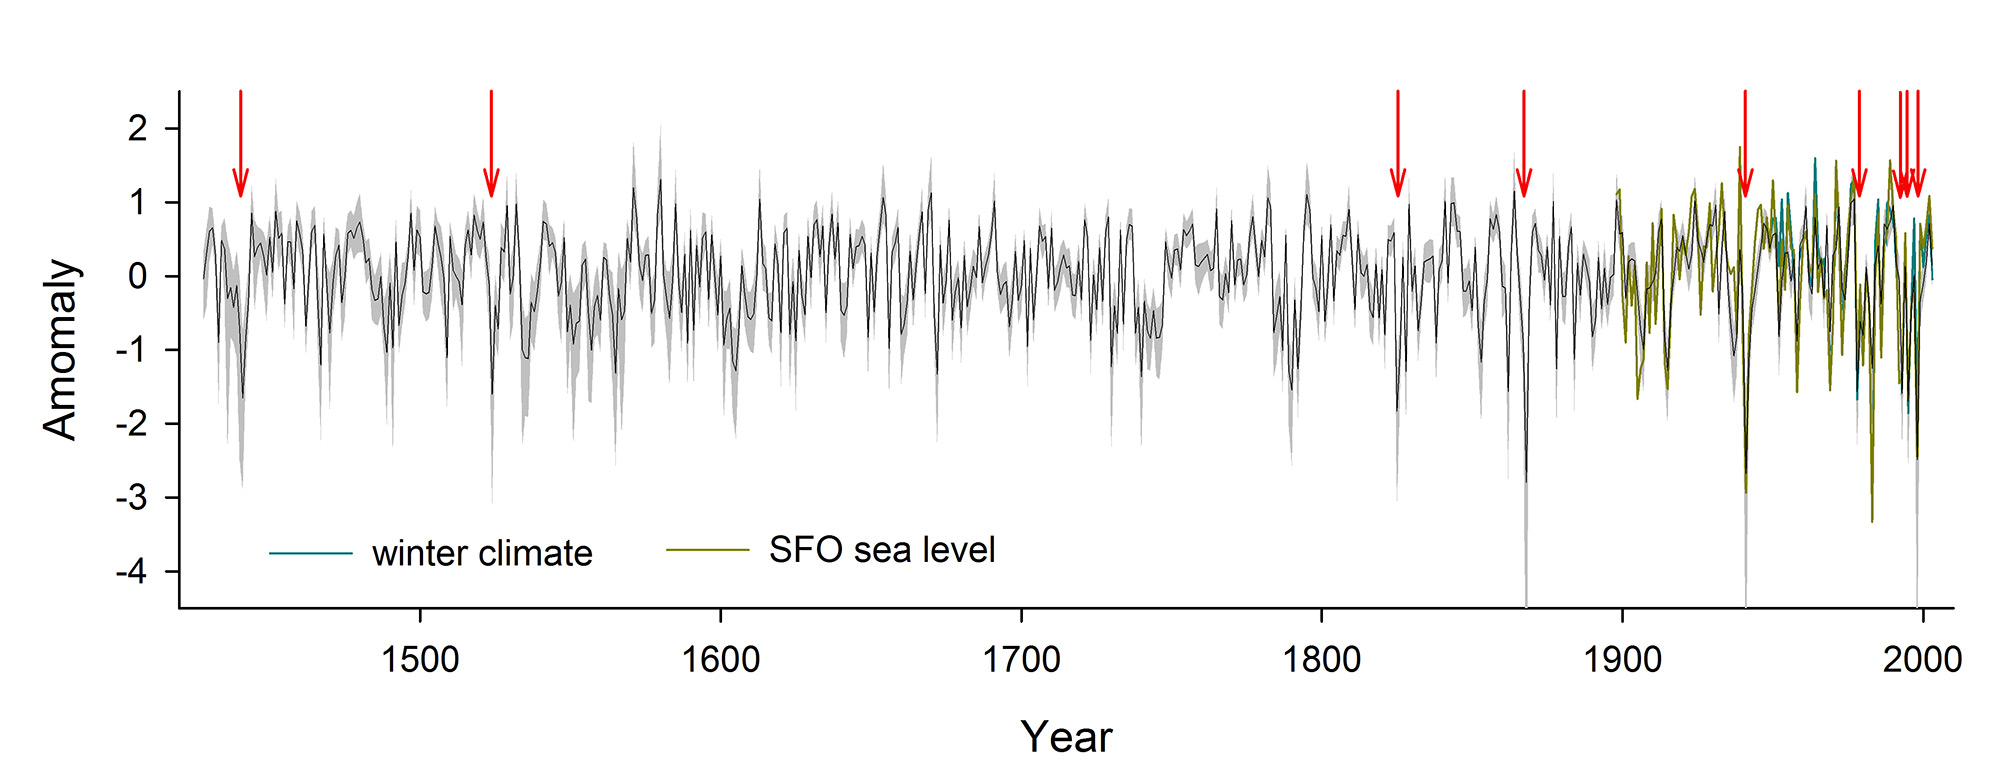
A history (1428-2003; black line) of winter climate in the California Current ecosystem derived from blue oak tree ring data. Positive anomalies represent years with above-average upwelling and marine productivity; negative values represent years with below-average upwelling and marine productivity. Gray shading indicates uncertainty. The green line is an instrumental record of winter climate, and the yellow line is an instrumental record of winter sea level at San Francisco (SFO), which is unusually long and a strong indicator of winter climate. Red arrows indicate the 10 most extreme negative anomalies in the winter climate history, corresponding to years 1441, 1524, 1825, 1862, 1868, 1941, 1978, 1993, 1995, and 1998. Image credit: University of Texas at Austin (Click image to enlarge)